Change parameters in a gtTheme to create a new theme.
setTheme(
  from = NULL,
  title = NULL,
  box = NULL,
  xAxis = NULL,
  yAxis = NULL,
  grid = NULL,
  legend = NULL,
  scale = NULL,
  parameters = NULL
)
Arguments
| from |
[gtTheme]
a gtTheme object to modify. |
| title |
[named list(3)]
|
| box |
[named list(5)]
plot [logical]
fillcol [character]
linewidth [numeric]
linetype [character]
linecol [character]
|
| xAxis |
[named list(5)]
plot [logical]
bins [numeric], into which to separate the tick labels
margin [numeric], proportion (0 - 1) of the plot that shall be taken by the margin
label [named list(5)]
plot [logical]
title [character]
fontsize [numeric]
colour [character]
rotation [numeric]
ticks [named list(5)]
|
| yAxis |
[named list(5)]
plot [logical]
bins [numeric]
margin [numeric]
label [named list(5)]
plot [logical]
title [character]
fontsize [numeric]
colour [character]
rotation [numeric]
ticks [named list(5)]
plot [logical]
fontsize [numeric]
colour [character]
rotation [numeric]
digits [numeric]
|
| grid |
[named list(5)]
|
| legend |
[named list(10)]
plot [logical]
bins [logical]
ascending [logical], order of values
position [logical] (currently only "right" possible)
orientation [logical] (currently only "vertical" possible)
xRatio [logical], ratio between the legend and the plot-box
yRatio [character]
digits [numeric]
label [named list(3)]
plot [logical]
fontsize [numeric]
colour [character]
box [named list(4)]
plot [logical]
linetype [character]
linewidth [numeric]
colour [character]
|
| scale |
[named list(6)]
param [logical] and
to [logical], specifying which parameter shall be scale to
which attribute
identity [logical]
range [numeric], that shall be represented by the
scale
bins [numeric], into which the values shall be classified
maxPixels [numeric]
|
| parameters |
[named list(6)]
|
Examples
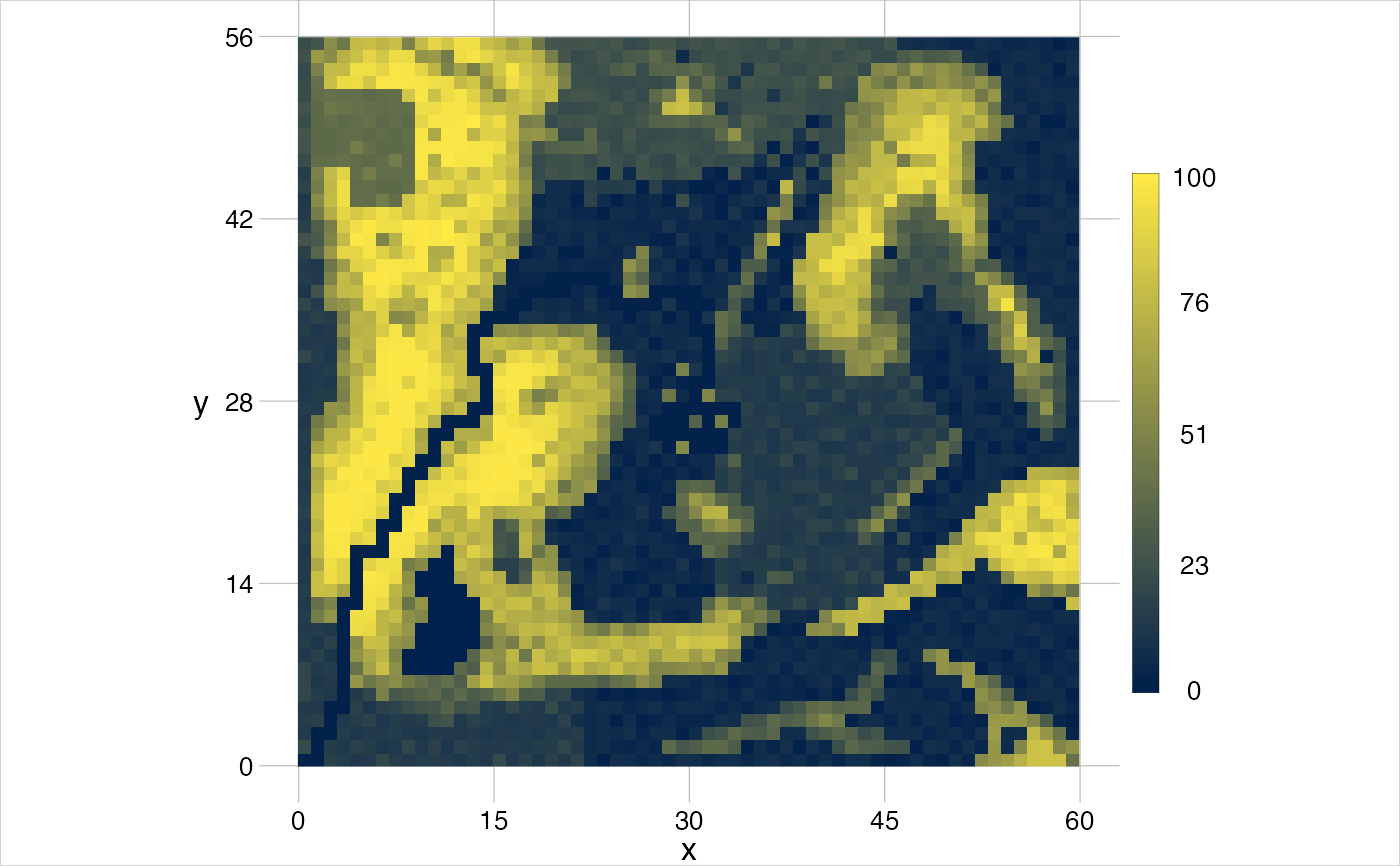
input <- gtGeoms$grid$continuous
(myTheme <- setTheme(title = list(plot = FALSE)))
#> ✖ title
#> ✔ box       in grey with 0.6 wide lines of type solid
#> ✔ xAxis     with 4 bins and a margin of 5%
#> ✔  - label  x in black with fontsize 12
#> ✔  - ticks  in black with fontsize 10 rounded to 1 digit
#> ✔ yAxis     with 4 bins and a margin of 5%
#> ✔  - label  y in black with fontsize 12
#> ✔  - ticks  in black with fontsize 10 rounded to 1 digit
#> ✔ grid      in grey with 0.6 wide lines of type solid
#> ✔ legend    with values ordered ascending in 4 bins and a relative height of 0.6
#> ✔  - label  in black with fontsize 10 rounded to 2 digits
#> ✔  - box    in black with 0.2 wide lines of type solid
#> ✔ objects   with line-colour black and fill-colour empty
#>             with 1 wide lines of type solid
#>             or 0.5 wide points of type 20

visualise(input, theme = myTheme)